CS2 Indexes FAQ

Common questions about CS2 category price indexes.

What is a CS2 category index?
Each index starts at 1,000 and combines eligible items' daily price changes using capped-log aggregation. It uses YouPin USD prices; an item qualifies with a Skinbase liquidity score of at least 40, and its weight is its entry price capped at $1,000.
How often are the category indexes updated?
Final points are calculated once per UTC day. Before today's final point is stored, the chart can show a provisional point from the latest complete YouPin cycle, marked with its calculation time.
How are item changes and YouPin data gaps handled?
Membership is evaluated daily. For liquidity up to 90, price moves below 0.5x or above 2x are excluded and quarantined until two valid closes; liquidity above 90 bypasses this guard. If usable YouPin coverage drops by more than 70%, the index carries forward its previous value.

CS2 index guide

CS2 Skin Price Indexes and Market Trends

Skinbase CS2 indexes track how groups of Counter-Strike 2 items change in value over time. Instead of following one skin or adding every listing into a market-cap total, each CS2 skin price index measures the price performance of an eligible basket. Use the overview to compare the broader market with weapon, container, sticker, and rarity segments, then open an individual index to inspect its chart and current items.

What is a CS2 market index?

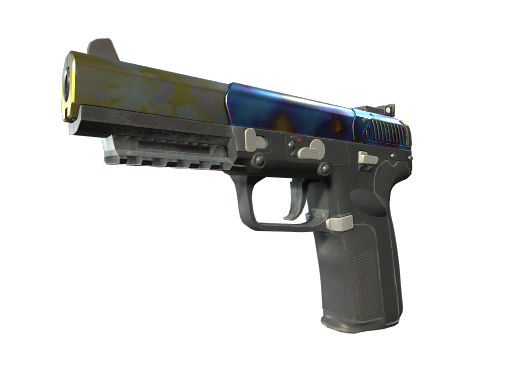
A CS2 market index is a normalized benchmark for a defined part of the skin economy. Skinbase maintains 17 indexes: an All Items benchmark, nine category indexes for agents, knives, gloves, rifles, pistols, SMGs, heavy weapons, cases, and stickers, and seven rarity indexes from Consumer Grade through Gold. This separation helps answer more useful questions than a single market-wide number. For example, knife prices may move differently from cases, while Covert items may follow a different trend from Mil-Spec items.

An index value is a point level, not a dollar price or the total value of every item in its category. The series starts at 1,000.00. If it later reaches 1,120.00, the eligible basket has gained 12% from that starting level. A reading of 920.00 represents an 8% decline. The percentage changes displayed for 7 days, 30 days, 90 days, 6 months, and 1 year make shorter periods easier to compare without calculating the difference yourself.

How Skinbase calculates the CS2 indexes

Each index follows a fixed category or rarity definition and uses eligible YouPin sell-price observations in USD as a consistent source. Items need a positive current price, available quantity, and sufficient catalog liquidity to enter the basket. The calculation tracks price returns rather than listing quantities, and an item's influence is based on its entry price with the weight capped at $1,000. This cap prevents a small number of exceptionally expensive items from dominating an entire category.

Normalized performanceDaily item returns are combined into one chain-linked index level, so additions and removals do not create artificial jumps simply because the basket changed.
Daily historyFinal values represent closed UTC days. A provisional value for the current day can be refreshed during the day and is replaced when the final daily calculation completes.
Stable comparisonsThe same methodology is applied across the All Items, category, and rarity series, making relative trend comparisons easier to interpret.

How to use the CS2 skin price indexes

  1. Step 1Start with the whole marketUse the All Items chart to establish the broader direction, then switch between 7D, 1M, 3M, 6M, 1Y, and All to separate short-term movement from a longer trend.
  2. Step 2Compare market segmentsReview category and rarity cards side by side. Their current level, 30-day mini chart, and percentage changes show which parts of the CS2 economy have moved together or diverged.
  3. Step 3Inspect the underlying itemsOpen a specific index to review its full chart and the current eligible items, including item prices, recent price history, and 30-day changes.

Why use Skinbase for CS2 market research?

Focused benchmarksCompare broad performance with dedicated weapon, container, sticker, and rarity indexes instead of relying on a single headline figure.
Transparent contextPoint levels, percentage changes, selectable time ranges, constituent items, and provisional-day markers provide context for every trend shown.
Connected price toolsMove from a market trend to individual item research and compare live offers across 30+ CS2 marketplaces without maintaining a separate spreadsheet.

Use the CS2 market cap tracker to study listed inventory value, browse CS2 skins for item-level data, check a Steam collection with the CS2 Inventory Value Checker, or open the CS2 marketplace comparison to review current offers from different providers.