Sticker Capsules ROI
Calculate expected returns and profit chances for CS2 sticker capsules, compare capsule contents, and find better value before opening.
steam
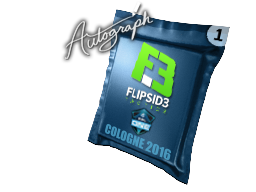
1
Autograph Capsule | Flipsid3 Tactics | Cologne 2016
ROI
537%
- Avg. Unbox
- $141.50
- Profit Chance
- 20.0%
- Total Cost
- $26.34
2
Autograph Capsule | Challengers (Foil) | Cologne 2016
ROI
199%
- Avg. Unbox
- $178.54
- Profit Chance
- 35.0%
- Total Cost
- $89.89

3
MLG Columbus 2016 Legends (Holo/Foil)
ROI
143%
- Avg. Unbox
- $43.03
- Profit Chance
- 61.1%
- Total Cost
- $30.14
4
Krakow 2017 Legends (Holo/Foil)
ROI
142%
- Avg. Unbox
- $19.97
- Profit Chance
- 63.0%
- Total Cost
- $14.07

5
ESL One Katowice 2015 Challengers (Holo/Foil)
ROI
138%
- Avg. Unbox
- $497.91
- Profit Chance
- 47.2%
- Total Cost
- $361.66
6
Atlanta 2017 Challengers (Holo/Foil)
ROI
136%
- Avg. Unbox
- $109.36
- Profit Chance
- 66.7%
- Total Cost
- $80.17
7
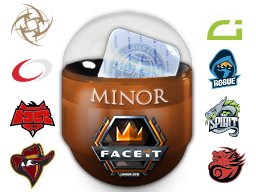
London 2018 Returning Challengers (Holo/Foil)
ROI
135%
- Avg. Unbox
- $20.46
- Profit Chance
- 61.1%
- Total Cost
- $15.17
8
Krakow 2017 Challengers (Holo/Foil)
ROI
133%
- Avg. Unbox
- $25.96
- Profit Chance
- 51.9%
- Total Cost
- $19.49
9
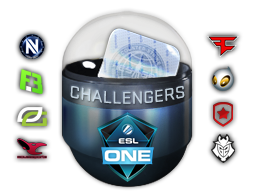
Cologne 2016 Challengers (Holo/Foil)
ROI
133%
- Avg. Unbox
- $41.57
- Profit Chance
- 50.0%
- Total Cost
- $31.29
10
ESL One Katowice 2015 Legends (Holo/Foil)
ROI
132%
- Avg. Unbox
- $198.39
- Profit Chance
- 35.0%
- Total Cost
- $149.94
11
MLG Columbus 2016 Challengers (Holo/Foil)
ROI
132%
- Avg. Unbox
- $47.99
- Profit Chance
- 79.6%
- Total Cost
- $36.44
12
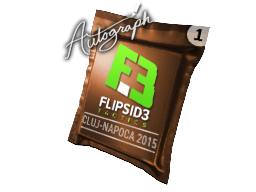
Autograph Capsule | Flipsid3 Tactics | Cluj-Napoca 2015
ROI
131%
- Avg. Unbox
- $20.34
- Profit Chance
- 40.0%
- Total Cost
- $15.57
13
DreamHack 2014 Legends (Holo/Foil)
ROI
130%
- Avg. Unbox
- $321.66
- Profit Chance
- 74.2%
- Total Cost
- $248.35
14
Boston 2018 Minor Challengers with Flash Gaming (Holo/Foil)
ROI
129%
- Avg. Unbox
- $40.88
- Profit Chance
- 48.1%
- Total Cost
- $31.79
15
Atlanta 2017 Legends (Holo/Foil)
ROI
128%
- Avg. Unbox
- $78.97
- Profit Chance
- 38.9%
- Total Cost
- $61.75
16
Boston 2018 Minor Challengers with Flash Gaming Autograph Capsule
ROI
127%
- Avg. Unbox
- $19.43
- Profit Chance
- 16.3%
- Total Cost
- $15.34

17
Autograph Capsule | Gambit Gaming | Atlanta 2017
ROI
123%
- Avg. Unbox
- $10.99
- Profit Chance
- 40.0%
- Total Cost
- $8.92
18
Boston 2018 Returning Challengers (Holo/Foil)
ROI
123%
- Avg. Unbox
- $50.09
- Profit Chance
- 40.7%
- Total Cost
- $40.74

19
Autograph Capsule | Legends (Foil) | Atlanta 2017
ROI
121%
- Avg. Unbox
- $101.32
- Profit Chance
- 40.0%
- Total Cost
- $84.03
20
London 2018 Legends (Holo/Foil)
ROI
119%
- Avg. Unbox
- $18.99
- Profit Chance
- 42.6%
- Total Cost
- $15.95
21
London 2018 Minor Challengers (Holo/Foil)
ROI
119%
- Avg. Unbox
- $20.55
- Profit Chance
- 42.6%
- Total Cost
- $17.30
22
Cologne 2016 Legends (Holo/Foil)
ROI
117%
- Avg. Unbox
- $28.48
- Profit Chance
- 37.0%
- Total Cost
- $24.25
23
Katowice 2019 Minor Challengers (Holo/Foil)
ROI
116%
- Avg. Unbox
- $7.86
- Profit Chance
- 36.4%
- Total Cost
- $6.76
24
Autograph Capsule | G2 Esports | Cluj-Napoca 2015
ROI
116%
- Avg. Unbox
- $7.82
- Profit Chance
- 40.0%
- Total Cost
- $6.76

25
Autograph Capsule | Challengers (Foil) | Cluj-Napoca 2015
ROI
116%
- Avg. Unbox
- $80.78
- Profit Chance
- 27.5%
- Total Cost
- $69.92
26
Autograph Capsule | North | Atlanta 2017
ROI
115%
- Avg. Unbox
- $11.57
- Profit Chance
- 60.0%
- Total Cost
- $10.07
27
Autograph Capsule | Challengers (Foil) | Atlanta 2017
ROI
112%
- Avg. Unbox
- $143.86
- Profit Chance
- 35.0%
- Total Cost
- $128.15
28
Autograph Capsule | Team Liquid | Atlanta 2017
ROI
108%
- Avg. Unbox
- $14.10
- Profit Chance
- 40.0%
- Total Cost
- $13.01
29
Autograph Capsule | mousesports | Cluj-Napoca 2015
ROI
108%
- Avg. Unbox
- $44.81
- Profit Chance
- 20.0%
- Total Cost
- $41.48
30
Autograph Capsule | Flipsid3 Tactics | Atlanta 2017
ROI
108%
- Avg. Unbox
- $18.13
- Profit Chance
- 60.0%
- Total Cost
- $16.81
31
Autograph Capsule | Legends (Foil) | Cologne 2016
ROI
106%
- Avg. Unbox
- $51.77
- Profit Chance
- 20.0%
- Total Cost
- $48.69

32
Boston 2018 Attending Legends (Holo/Foil)
ROI
106%
- Avg. Unbox
- $29.44
- Profit Chance
- 54.2%
- Total Cost
- $27.69
33
Autograph Capsule | Renegades | Cologne 2015
ROI
104%
- Avg. Unbox
- $9.35
- Profit Chance
- 60.0%
- Total Cost
- $8.98
34
Katowice 2019 Legends (Holo/Foil)
ROI
101%
- Avg. Unbox
- $8.80
- Profit Chance
- 44.4%
- Total Cost
- $8.72
35
Autograph Capsule | Titan | Cluj-Napoca 2015
ROI
101%
- Avg. Unbox
- $24.48
- Profit Chance
- 40.0%
- Total Cost
- $24.34

36
Autograph Capsule | G2 Esports | Atlanta 2017
ROI
100%
- Avg. Unbox
- $9.92
- Profit Chance
- 20.0%
- Total Cost
- $9.90
37
ESL One Cologne 2015 Legends (Foil)
ROI
99%
- Avg. Unbox
- $25.39
- Profit Chance
- 22.2%
- Total Cost
- $25.76
38
Autograph Capsule | Flipsid3 Tactics | Cologne 2015
ROI
98%
- Avg. Unbox
- $18.53
- Profit Chance
- 20.0%
- Total Cost
- $19.00
39
Autograph Capsule | Gambit Gaming | Cologne 2016
ROI
97%
- Avg. Unbox
- $15.40
- Profit Chance
- 40.0%
- Total Cost
- $15.89
40
ESL One Cologne 2015 Challengers (Foil)
ROI
96%
- Avg. Unbox
- $42.38
- Profit Chance
- 22.2%
- Total Cost
- $44.23

41
Autograph Capsule | Team EnVyUs | Cluj-Napoca 2015
ROI
96%
- Avg. Unbox
- $6.04
- Profit Chance
- 20.0%
- Total Cost
- $6.30
42
DreamHack Cluj-Napoca 2015 Legends (Foil)
ROI
95%
- Avg. Unbox
- $22.14
- Profit Chance
- 33.3%
- Total Cost
- $23.31
43
Berlin 2019 Returning Challengers (Holo/Foil)
ROI
95%
- Avg. Unbox
- $2.00
- Profit Chance
- 22.2%
- Total Cost
- $2.11
44
Autograph Capsule | Team EnVyUs | Cologne 2015
ROI
94%
- Avg. Unbox
- $6.79
- Profit Chance
- 20.0%
- Total Cost
- $7.19

45
Halo Capsule
ROI
94%
- Avg. Unbox
- $0.79
- Profit Chance
- 40.1%
- Total Cost
- $0.84
46
Katowice 2019 Returning Challengers (Holo/Foil)
ROI
94%
- Avg. Unbox
- $9.68
- Profit Chance
- 40.5%
- Total Cost
- $10.34
47
DreamHack Cluj-Napoca 2015 Challengers (Foil)
ROI
93%
- Avg. Unbox
- $63.59
- Profit Chance
- 22.2%
- Total Cost
- $68.04

48
Autograph Capsule | Challengers (Foil) | MLG Columbus 2016
ROI
93%
- Avg. Unbox
- $57.57
- Profit Chance
- 22.5%
- Total Cost
- $61.65
49
Berlin 2019 Legends (Holo/Foil)
ROI
93%
- Avg. Unbox
- $1.12
- Profit Chance
- 14.8%
- Total Cost
- $1.21
50
Autograph Capsule | Virtus.Pro | Cluj-Napoca 2015
ROI
92%
- Avg. Unbox
- $6.75
- Profit Chance
- 20.0%
- Total Cost
- $7.33
51
Autograph Capsule | G2 Esports | Cologne 2016
ROI
92%
- Avg. Unbox
- $27.77
- Profit Chance
- 20.0%
- Total Cost
- $30.24
52
Autograph Capsule | Cloud9 | Cluj-Napoca 2015
ROI
91%
- Avg. Unbox
- $14.59
- Profit Chance
- 60.0%
- Total Cost
- $16.00
53
Autograph Capsule | Team Kinguin | Cologne 2015
ROI
90%
- Avg. Unbox
- $8.03
- Profit Chance
- 20.0%
- Total Cost
- $8.91

54
Pinups Capsule
ROI
90%
- Avg. Unbox
- $0.77
- Profit Chance
- 37.4%
- Total Cost
- $0.86
55
London 2018 Returning Challengers Autograph Capsule
ROI
89%
- Avg. Unbox
- $8.86
- Profit Chance
- 14.6%
- Total Cost
- $9.90

56
Enfu Sticker Capsule
ROI
89%
- Avg. Unbox
- $0.90
- Profit Chance
- 24.3%
- Total Cost
- $1.01

57
Autograph Capsule | SK Gaming | Atlanta 2017
ROI
89%
- Avg. Unbox
- $8.59
- Profit Chance
- 40.0%
- Total Cost
- $9.63
58
Autograph Capsule | FaZe Clan | Cologne 2016
ROI
88%
- Avg. Unbox
- $11.46
- Profit Chance
- 40.0%
- Total Cost
- $13.02
59
Autograph Capsule | Cloud9 G2A | Cologne 2015
ROI
87%
- Avg. Unbox
- $9.35
- Profit Chance
- 40.0%
- Total Cost
- $10.72
60
Berlin 2019 Minor Challengers (Holo/Foil)
ROI
86%
- Avg. Unbox
- $1.25
- Profit Chance
- 20.8%
- Total Cost
- $1.45

61
Perfect World Sticker Capsule 2
ROI
86%
- Avg. Unbox
- $0.81
- Profit Chance
- 25.9%
- Total Cost
- $0.95
62
Autograph Capsule | Team EnVyUs | Atlanta 2017
ROI
85%
- Avg. Unbox
- $14.18
- Profit Chance
- 20.0%
- Total Cost
- $16.68
63
Autograph Capsule | Team Dignitas | Cluj-Napoca 2015
ROI
85%
- Avg. Unbox
- $36.11
- Profit Chance
- 20.0%
- Total Cost
- $42.59
64
Warhammer 40,000 Xenos Sticker Capsule
ROI
85%
- Avg. Unbox
- $0.83
- Profit Chance
- 17.8%
- Total Cost
- $0.98
65
Autograph Capsule | Legends (Foil) | Cluj-Napoca 2015
ROI
84%
- Avg. Unbox
- $29.41
- Profit Chance
- 22.5%
- Total Cost
- $34.84
66
Autograph Capsule | Team Liquid | Cluj-Napoca 2015
ROI
84%
- Avg. Unbox
- $9.01
- Profit Chance
- 20.0%
- Total Cost
- $10.72
67
Autograph Capsule | Virtus.Pro | Cologne 2015
ROI
83%
- Avg. Unbox
- $7.01
- Profit Chance
- 20.0%
- Total Cost
- $8.41
68
Autograph Capsule | Team SoloMid | Cologne 2015
ROI
83%
- Avg. Unbox
- $4.27
- Profit Chance
- 40.0%
- Total Cost
- $5.15
69
Autograph Capsule | Counter Logic Gaming | Cluj-Napoca 2015
ROI
82%
- Avg. Unbox
- $8.99
- Profit Chance
- 20.0%
- Total Cost
- $11.00
70
Feral Predators Capsule
ROI
81%
- Avg. Unbox
- $0.85
- Profit Chance
- 29.0%
- Total Cost
- $1.05
71
Warhammer 40,000 Imperium Sticker Capsule
ROI
80%
- Avg. Unbox
- $0.87
- Profit Chance
- 13.4%
- Total Cost
- $1.09
72
Autograph Capsule | Team eBettle | Cologne 2015
ROI
80%
- Avg. Unbox
- $11.68
- Profit Chance
- 20.0%
- Total Cost
- $14.60
73
Autograph Capsule | Flipsid3 Tactics | MLG Columbus 2016
ROI
78%
- Avg. Unbox
- $10.85
- Profit Chance
- 20.0%
- Total Cost
- $13.85
74
Shanghai 2024 Challengers Autograph Capsule
ROI
78%
- Avg. Unbox
- $0.33
- Profit Chance
- 6.8%
- Total Cost
- $0.42
75
Autograph Capsule | Team SoloMid | Cluj-Napoca 2015
ROI
78%
- Avg. Unbox
- $4.62
- Profit Chance
- 0.0%
- Total Cost
- $5.91
76
Autograph Capsule | OpTic Gaming | Atlanta 2017
ROI
78%
- Avg. Unbox
- $16.42
- Profit Chance
- 20.0%
- Total Cost
- $21.16

77
The Boardroom Sticker Capsule
ROI
77%
- Avg. Unbox
- $0.80
- Profit Chance
- 21.1%
- Total Cost
- $1.04
78
Autograph Capsule | Counter Logic Gaming | Cologne 2015
ROI
77%
- Avg. Unbox
- $7.89
- Profit Chance
- 0.0%
- Total Cost
- $10.24

79
Half-Life: Alyx Sticker Capsule
ROI
76%
- Avg. Unbox
- $0.68
- Profit Chance
- 11.2%
- Total Cost
- $0.89
80
Warhammer 40,000 Adeptus Astartes Sticker Capsule
ROI
76%
- Avg. Unbox
- $0.76
- Profit Chance
- 31.2%
- Total Cost
- $1.01
81
Boston 2018 Returning Challengers Autograph Capsule
ROI
75%
- Avg. Unbox
- $11.12
- Profit Chance
- 9.5%
- Total Cost
- $14.80

82
Rio 2022 Challengers Autograph Capsule
ROI
75%
- Avg. Unbox
- $0.31
- Profit Chance
- 6.7%
- Total Cost
- $0.42

83
Perfect World Sticker Capsule 1
ROI
75%
- Avg. Unbox
- $0.80
- Profit Chance
- 39.3%
- Total Cost
- $1.08
84
Autograph Capsule | Natus Vincere | Atlanta 2017
ROI
74%
- Avg. Unbox
- $16.73
- Profit Chance
- 20.0%
- Total Cost
- $22.51
85
London 2018 Minor Challengers Autograph Capsule
ROI
74%
- Avg. Unbox
- $6.40
- Profit Chance
- 12.3%
- Total Cost
- $8.62
86
Autograph Capsule | Astralis | Cologne 2016
ROI
74%
- Avg. Unbox
- $14.32
- Profit Chance
- 40.0%
- Total Cost
- $19.32
87
Autograph Capsule | Team EnVyUs | Cologne 2016
ROI
73%
- Avg. Unbox
- $18.05
- Profit Chance
- 20.0%
- Total Cost
- $24.64
88
Copenhagen 2024 Challengers Autograph Capsule
ROI
73%
- Avg. Unbox
- $0.28
- Profit Chance
- 9.5%
- Total Cost
- $0.38

89
Antwerp 2022 Contenders Sticker Capsule
ROI
73%
- Avg. Unbox
- $0.35
- Profit Chance
- 11.0%
- Total Cost
- $0.48
90
London 2018 Legends Autograph Capsule
ROI
72%
- Avg. Unbox
- $7.65
- Profit Chance
- 8.2%
- Total Cost
- $10.65
91
Autograph Capsule | GODSENT | Atlanta 2017
ROI
72%
- Avg. Unbox
- $4.63
- Profit Chance
- 0.0%
- Total Cost
- $6.45
92
Rio 2022 Contenders Autograph Capsule
ROI
71%
- Avg. Unbox
- $0.25
- Profit Chance
- 9.5%
- Total Cost
- $0.35
93
Autograph Capsule | OpTic Gaming | Cologne 2016
ROI
70%
- Avg. Unbox
- $11.01
- Profit Chance
- 20.0%
- Total Cost
- $15.71

94
Antwerp 2022 Champions Autograph Capsule
ROI
69%
- Avg. Unbox
- $0.29
- Profit Chance
- 3.8%
- Total Cost
- $0.42

95
Krakow 2017 Challengers Autograph Capsule
ROI
69%
- Avg. Unbox
- $18.29
- Profit Chance
- 13.1%
- Total Cost
- $26.34

96
Autograph Capsule | Astralis | Atlanta 2017
ROI
69%
- Avg. Unbox
- $7.28
- Profit Chance
- 20.0%
- Total Cost
- $10.53
97
Autograph Capsule | Team EnVyUs | MLG Columbus 2016
ROI
69%
- Avg. Unbox
- $9.52
- Profit Chance
- 20.0%
- Total Cost
- $13.84
98
Poorly Drawn Capsule
ROI
68%
- Avg. Unbox
- $0.59
- Profit Chance
- 16.0%
- Total Cost
- $0.86
99
Autograph Capsule | mousesports | Atlanta 2017
ROI
68%
- Avg. Unbox
- $15.26
- Profit Chance
- 20.0%
- Total Cost
- $22.36

100
Autograph Capsule | Luminosity Gaming | MLG Columbus 2016
ROI
68%
- Avg. Unbox
- $7.54
- Profit Chance
- 20.0%
- Total Cost
- $11.09

101
Bestiary Capsule
ROI
67%
- Avg. Unbox
- $0.69
- Profit Chance
- 18.7%
- Total Cost
- $1.03

102
Paris 2023 Contenders Sticker Capsule
ROI
67%
- Avg. Unbox
- $0.07
- Profit Chance
- 5.6%
- Total Cost
- $0.10
103
Autograph Capsule | Luminosity Gaming | Cologne 2015
ROI
67%
- Avg. Unbox
- $16.08
- Profit Chance
- 20.0%
- Total Cost
- $24.09
104
Sugarface Capsule
ROI
67%
- Avg. Unbox
- $0.70
- Profit Chance
- 16.0%
- Total Cost
- $1.05
105
Autograph Capsule | Vexed Gaming | Cluj-Napoca 2015
ROI
67%
- Avg. Unbox
- $22.99
- Profit Chance
- 0.0%
- Total Cost
- $34.47

106
Boston 2018 Attending Legends Autograph Capsule
ROI
67%
- Avg. Unbox
- $8.08
- Profit Chance
- 7.5%
- Total Cost
- $12.13
107
Paris 2023 Challengers Sticker Capsule
ROI
66%
- Avg. Unbox
- $0.07
- Profit Chance
- 3.8%
- Total Cost
- $0.11

108
Austin 2025 Challengers Autograph Capsule
ROI
66%
- Avg. Unbox
- $0.21
- Profit Chance
- 12.2%
- Total Cost
- $0.32
109
Sticker Capsule 2
ROI
66%
- Avg. Unbox
- $9.79
- Profit Chance
- 1.6%
- Total Cost
- $14.74
110
Battlefield 2042 Sticker Capsule
ROI
66%
- Avg. Unbox
- $0.56
- Profit Chance
- 15.2%
- Total Cost
- $0.85
111
Autograph Capsule | Legends (Foil) | MLG Columbus 2016
ROI
66%
- Avg. Unbox
- $32.18
- Profit Chance
- 15.0%
- Total Cost
- $48.50

112
Autograph Capsule | G2 Esports | MLG Columbus 2016
ROI
66%
- Avg. Unbox
- $20.90
- Profit Chance
- 20.0%
- Total Cost
- $31.69
113
Community Sticker Capsule 1
ROI
65%
- Avg. Unbox
- $2.70
- Profit Chance
- 3.2%
- Total Cost
- $4.12
114
Shanghai 2024 Contenders Autograph Capsule
ROI
65%
- Avg. Unbox
- $0.25
- Profit Chance
- 14.2%
- Total Cost
- $0.38
115
10 Year Birthday Sticker Capsule
ROI
65%
- Avg. Unbox
- $0.54
- Profit Chance
- 11.9%
- Total Cost
- $0.83
116
Paris 2023 Contenders Autograph Capsule
ROI
65%
- Avg. Unbox
- $0.08
- Profit Chance
- 4.2%
- Total Cost
- $0.12
117
Autograph Capsule | Team Immunity | Cologne 2015
ROI
65%
- Avg. Unbox
- $11.62
- Profit Chance
- 20.0%
- Total Cost
- $17.94
118
Antwerp 2022 Challengers Sticker Capsule
ROI
65%
- Avg. Unbox
- $0.18
- Profit Chance
- 11.0%
- Total Cost
- $0.28
119
Paris 2023 Legends Sticker Capsule
ROI
64%
- Avg. Unbox
- $0.08
- Profit Chance
- 7.1%
- Total Cost
- $0.12
120
Autograph Capsule | mousesports | MLG Columbus 2016
ROI
64%
- Avg. Unbox
- $8.11
- Profit Chance
- 20.0%
- Total Cost
- $12.66
121
Krakow 2017 Legends Autograph Capsule
ROI
64%
- Avg. Unbox
- $15.92
- Profit Chance
- 8.7%
- Total Cost
- $24.92
122
Autograph Capsule | Natus Vincere | Cluj-Napoca 2015
ROI
64%
- Avg. Unbox
- $4.30
- Profit Chance
- 0.0%
- Total Cost
- $6.74

123
Autograph Capsule | Gambit Gaming | MLG Columbus 2016
ROI
64%
- Avg. Unbox
- $6.75
- Profit Chance
- 20.0%
- Total Cost
- $10.59
124
Austin 2025 Contenders Sticker Capsule
ROI
63%
- Avg. Unbox
- $0.13
- Profit Chance
- 3.8%
- Total Cost
- $0.21
125
Autograph Capsule | FaZe Clan | Atlanta 2017
ROI
63%
- Avg. Unbox
- $10.99
- Profit Chance
- 20.0%
- Total Cost
- $17.42
126
Copenhagen 2024 Challengers Sticker Capsule
ROI
63%
- Avg. Unbox
- $0.37
- Profit Chance
- 9.2%
- Total Cost
- $0.59
127
Stockholm 2021 Contenders Sticker Capsule
ROI
63%
- Avg. Unbox
- $1.05
- Profit Chance
- 17.0%
- Total Cost
- $1.67
128
Autograph Capsule | Team Liquid | Cologne 2016
ROI
62%
- Avg. Unbox
- $7.66
- Profit Chance
- 20.0%
- Total Cost
- $12.31
129
Autograph Capsule | Fnatic | Cologne 2015
ROI
62%
- Avg. Unbox
- $3.08
- Profit Chance
- 0.0%
- Total Cost
- $5.00

130
Ambush Sticker Capsule
ROI
61%
- Avg. Unbox
- $0.60
- Profit Chance
- 11.1%
- Total Cost
- $0.98
131
Autograph Capsule | Titan | Cologne 2015
ROI
61%
- Avg. Unbox
- $17.19
- Profit Chance
- 0.0%
- Total Cost
- $27.99
132
Sticker Capsule
ROI
61%
- Avg. Unbox
- $1.06
- Profit Chance
- 13.9%
- Total Cost
- $1.73
133
Stockholm 2021 Challengers Sticker Capsule
ROI
61%
- Avg. Unbox
- $1.23
- Profit Chance
- 14.9%
- Total Cost
- $2.02
134
Austin 2025 Challengers Sticker Capsule
ROI
61%
- Avg. Unbox
- $0.14
- Profit Chance
- 7.4%
- Total Cost
- $0.23
135
Autograph Capsule | FaZe Clan | MLG Columbus 2016
ROI
60%
- Avg. Unbox
- $5.60
- Profit Chance
- 0.0%
- Total Cost
- $9.28
136
ESL One Cologne 2014 Challengers
ROI
60%
- Avg. Unbox
- $46.49
- Profit Chance
- 28.8%
- Total Cost
- $77.22
137
Autograph Capsule | Virtus.Pro | Cologne 2016
ROI
60%
- Avg. Unbox
- $7.46
- Profit Chance
- 20.0%
- Total Cost
- $12.46
138
Autograph Capsule | SK Gaming | Cologne 2016
ROI
60%
- Avg. Unbox
- $7.05
- Profit Chance
- 20.0%
- Total Cost
- $11.85
139
Budapest 2025 Contenders Sticker Capsule
ROI
59%
- Avg. Unbox
- $0.08
- Profit Chance
- 3.8%
- Total Cost
- $0.14
140
Rio 2022 Legends Autograph Capsule
ROI
59%
- Avg. Unbox
- $0.18
- Profit Chance
- 6.7%
- Total Cost
- $0.31

141
Jackass Sticker Capsule
ROI
58%
- Avg. Unbox
- $0.32
- Profit Chance
- 17.0%
- Total Cost
- $0.55
142
Autograph Capsule | mousesports | Cologne 2016
ROI
58%
- Avg. Unbox
- $19.51
- Profit Chance
- 20.0%
- Total Cost
- $33.50

143
Budapest 2025 Contenders Autograph Capsule
ROI
58%
- Avg. Unbox
- $0.16
- Profit Chance
- 6.0%
- Total Cost
- $0.27

144
Autograph Capsule | Splyce | MLG Columbus 2016
ROI
58%
- Avg. Unbox
- $6.84
- Profit Chance
- 20.0%
- Total Cost
- $11.78
145
Autograph Capsule | Fnatic | Cluj-Napoca 2015
ROI
58%
- Avg. Unbox
- $3.37
- Profit Chance
- 0.0%
- Total Cost
- $5.82
146
Antwerp 2022 Legends Sticker Capsule
ROI
58%
- Avg. Unbox
- $0.24
- Profit Chance
- 11.0%
- Total Cost
- $0.42

147
Autograph Capsule | Ninjas in Pyjamas | Cologne 2015
ROI
57%
- Avg. Unbox
- $2.81
- Profit Chance
- 0.0%
- Total Cost
- $4.96
148
Autograph Capsule | Luminosity Gaming | Cluj-Napoca 2015
ROI
57%
- Avg. Unbox
- $19.59
- Profit Chance
- 20.0%
- Total Cost
- $34.59

149
Skill Groups Capsule
ROI
56%
- Avg. Unbox
- $0.53
- Profit Chance
- 10.1%
- Total Cost
- $0.95
150
ESL One Cologne 2014 Legends
ROI
55%
- Avg. Unbox
- $47.85
- Profit Chance
- 7.2%
- Total Cost
- $86.31
151
Copenhagen 2024 Contenders Sticker Capsule
ROI
55%
- Avg. Unbox
- $0.19
- Profit Chance
- 9.2%
- Total Cost
- $0.34
152
Austin 2025 Contenders Autograph Capsule
ROI
55%
- Avg. Unbox
- $0.14
- Profit Chance
- 7.2%
- Total Cost
- $0.26

153
Rio 2022 Contenders Sticker Capsule
ROI
55%
- Avg. Unbox
- $0.14
- Profit Chance
- 5.6%
- Total Cost
- $0.25

154
Autograph Capsule | Team Liquid | MLG Columbus 2016
ROI
54%
- Avg. Unbox
- $8.57
- Profit Chance
- 20.0%
- Total Cost
- $15.78
155
Budapest 2025 Challengers Autograph Capsule
ROI
54%
- Avg. Unbox
- $0.15
- Profit Chance
- 5.4%
- Total Cost
- $0.27

156
2021 Community Sticker Capsule
ROI
54%
- Avg. Unbox
- $0.53
- Profit Chance
- 5.9%
- Total Cost
- $0.98
157
2020 RMR Challengers
ROI
53%
- Avg. Unbox
- $0.13
- Profit Chance
- 17.9%
- Total Cost
- $0.24
158
Copenhagen 2024 Legends Sticker Capsule
ROI
53%
- Avg. Unbox
- $0.25
- Profit Chance
- 9.2%
- Total Cost
- $0.48

159
Shanghai 2024 Contenders Sticker Capsule
ROI
52%
- Avg. Unbox
- $0.26
- Profit Chance
- 7.4%
- Total Cost
- $0.49
160
Stockholm 2021 Legends Sticker Capsule
ROI
52%
- Avg. Unbox
- $0.63
- Profit Chance
- 16.7%
- Total Cost
- $1.21
161
Shanghai 2024 Challengers Sticker Capsule
ROI
52%
- Avg. Unbox
- $0.24
- Profit Chance
- 3.8%
- Total Cost
- $0.47

162
Autograph Capsule | Cloud9 | MLG Columbus 2016
ROI
51%
- Avg. Unbox
- $22.76
- Profit Chance
- 0.0%
- Total Cost
- $44.35
163
Paris 2023 Challengers Autograph Capsule
ROI
51%
- Avg. Unbox
- $0.07
- Profit Chance
- 4.6%
- Total Cost
- $0.13
164
Copenhagen 2024 Contenders Autograph Capsule
ROI
51%
- Avg. Unbox
- $0.12
- Profit Chance
- 7.0%
- Total Cost
- $0.23
165
Rio 2022 Challengers Sticker Capsule
ROI
51%
- Avg. Unbox
- $0.12
- Profit Chance
- 7.4%
- Total Cost
- $0.24
166
Autograph Capsule | Ninjas in Pyjamas | Cluj-Napoca 2015
ROI
51%
- Avg. Unbox
- $2.88
- Profit Chance
- 0.0%
- Total Cost
- $5.71
167
Budapest 2025 Challengers Sticker Capsule
ROI
50%
- Avg. Unbox
- $0.09
- Profit Chance
- 3.8%
- Total Cost
- $0.17
168
Antwerp 2022 Legends Autograph Capsule
ROI
50%
- Avg. Unbox
- $0.19
- Profit Chance
- 4.1%
- Total Cost
- $0.38
169
Warhammer 40,000 Traitor Astartes Sticker Capsule
ROI
50%
- Avg. Unbox
- $0.52
- Profit Chance
- 13.4%
- Total Cost
- $1.03
170
2020 RMR Contenders
ROI
50%
- Avg. Unbox
- $0.17
- Profit Chance
- 9.1%
- Total Cost
- $0.35
171
Budapest 2025 Legends Sticker Capsule
ROI
50%
- Avg. Unbox
- $0.09
- Profit Chance
- 3.8%
- Total Cost
- $0.18
172
Paris 2023 Legends Autograph Capsule
ROI
49%
- Avg. Unbox
- $0.08
- Profit Chance
- 6.0%
- Total Cost
- $0.17
173
Austin 2025 Legends Sticker Capsule
ROI
49%
- Avg. Unbox
- $0.10
- Profit Chance
- 3.8%
- Total Cost
- $0.20

174
Community Capsule 2018
ROI
49%
- Avg. Unbox
- $0.49
- Profit Chance
- 15.2%
- Total Cost
- $1.00
175
Katowice 2019 Returning Challengers Autograph Capsule
ROI
49%
- Avg. Unbox
- $3.23
- Profit Chance
- 11.9%
- Total Cost
- $6.64
176
Autograph Capsule | Fnatic | Atlanta 2017
ROI
49%
- Avg. Unbox
- $4.31
- Profit Chance
- 0.0%
- Total Cost
- $8.87

177
Autograph Capsule | Counter Logic Gaming | MLG Columbus 2016
ROI
48%
- Avg. Unbox
- $6.08
- Profit Chance
- 0.0%
- Total Cost
- $12.80
178
Berlin 2019 Minor Challengers Autograph Capsule
ROI
47%
- Avg. Unbox
- $1.22
- Profit Chance
- 5.6%
- Total Cost
- $2.58
179
Rio 2022 Champions Autograph Capsule
ROI
47%
- Avg. Unbox
- $0.19
- Profit Chance
- 14.1%
- Total Cost
- $0.40
180
Autograph Capsule | mousesports | Cologne 2015
ROI
47%
- Avg. Unbox
- $6.29
- Profit Chance
- 0.0%
- Total Cost
- $13.47

181
Chicken Capsule
ROI
46%
- Avg. Unbox
- $0.47
- Profit Chance
- 3.2%
- Total Cost
- $1.01
182
Antwerp 2022 Challengers Autograph Capsule
ROI
46%
- Avg. Unbox
- $0.15
- Profit Chance
- 5.0%
- Total Cost
- $0.32
183
Autograph Capsule | Virtus.Pro | Atlanta 2017
ROI
46%
- Avg. Unbox
- $5.03
- Profit Chance
- 0.0%
- Total Cost
- $11.00
184
Rio 2022 Legends Sticker Capsule
ROI
44%
- Avg. Unbox
- $0.15
- Profit Chance
- 5.6%
- Total Cost
- $0.34

185
Slid3 Capsule
ROI
44%
- Avg. Unbox
- $0.46
- Profit Chance
- 9.0%
- Total Cost
- $1.06

186
Autograph Capsule | Group B (Foil) | Cologne 2015
ROI
43%
- Avg. Unbox
- $12.36
- Profit Chance
- 10.0%
- Total Cost
- $28.56
187
Katowice 2019 Minor Challengers Autograph Capsule
ROI
43%
- Avg. Unbox
- $3.60
- Profit Chance
- 8.0%
- Total Cost
- $8.39
188
Team Roles Capsule
ROI
41%
- Avg. Unbox
- $0.41
- Profit Chance
- 3.2%
- Total Cost
- $0.98

189
Stockholm 2021 Finalists Autograph Capsule
ROI
41%
- Avg. Unbox
- $0.31
- Profit Chance
- 8.0%
- Total Cost
- $0.75

190
Warhammer 40,000 Sticker Capsule
ROI
41%
- Avg. Unbox
- $0.44
- Profit Chance
- 3.2%
- Total Cost
- $1.09
191
2020 RMR Legends
ROI
41%
- Avg. Unbox
- $0.10
- Profit Chance
- 7.1%
- Total Cost
- $0.24
192
Berlin 2019 Legends Autograph Capsule
ROI
40%
- Avg. Unbox
- $0.60
- Profit Chance
- 7.5%
- Total Cost
- $1.51
193
Copenhagen 2024 Legends Autograph Capsule
ROI
40%
- Avg. Unbox
- $0.20
- Profit Chance
- 4.8%
- Total Cost
- $0.50
194
Katowice 2019 Legends Autograph Capsule
ROI
40%
- Avg. Unbox
- $2.62
- Profit Chance
- 4.2%
- Total Cost
- $6.61

195
Espionage Sticker Capsule
ROI
39%
- Avg. Unbox
- $0.36
- Profit Chance
- 10.1%
- Total Cost
- $0.92
196
Shanghai 2024 Legends Sticker Capsule
ROI
39%
- Avg. Unbox
- $0.32
- Profit Chance
- 3.8%
- Total Cost
- $0.82
197
Antwerp 2022 Contenders Autograph Capsule
ROI
38%
- Avg. Unbox
- $0.27
- Profit Chance
- 4.1%
- Total Cost
- $0.71
198
Autograph Capsule | Natus Vincere | Cologne 2015
ROI
37%
- Avg. Unbox
- $3.20
- Profit Chance
- 0.0%
- Total Cost
- $8.67
199
CS20 Sticker Capsule
ROI
36%
- Avg. Unbox
- $0.30
- Profit Chance
- 6.4%
- Total Cost
- $0.83
200
Shanghai 2024 Legends Autograph Capsule
ROI
36%
- Avg. Unbox
- $0.10
- Profit Chance
- 4.3%
- Total Cost
- $0.27

201
Autograph Capsule | HellRaisers | Atlanta 2017
ROI
36%
- Avg. Unbox
- $10.06
- Profit Chance
- 0.0%
- Total Cost
- $28.19
202
Berlin 2019 Returning Challengers Autograph Capsule
ROI
35%
- Avg. Unbox
- $0.47
- Profit Chance
- 6.4%
- Total Cost
- $1.34
203
Autograph Capsule | Ninjas in Pyjamas | Cologne 2016
ROI
35%
- Avg. Unbox
- $3.72
- Profit Chance
- 0.0%
- Total Cost
- $10.64

204
Autograph Capsule | Virtus.Pro | MLG Columbus 2016
ROI
34%
- Avg. Unbox
- $4.73
- Profit Chance
- 0.0%
- Total Cost
- $14.00
205
Austin 2025 Legends Autograph Capsule
ROI
33%
- Avg. Unbox
- $0.11
- Profit Chance
- 5.6%
- Total Cost
- $0.34
206
Austin 2025 Champions Autograph Capsule
ROI
33%
- Avg. Unbox
- $0.10
- Profit Chance
- 2.2%
- Total Cost
- $0.30
207
Autograph Capsule | Astralis | MLG Columbus 2016
ROI
32%
- Avg. Unbox
- $5.36
- Profit Chance
- 0.0%
- Total Cost
- $16.56
208
Shanghai 2024 Champions Autograph Capsule
ROI
31%
- Avg. Unbox
- $0.15
- Profit Chance
- 5.4%
- Total Cost
- $0.47
209
Autograph Capsule | Ninjas in Pyjamas | MLG Columbus 2016
ROI
31%
- Avg. Unbox
- $2.88
- Profit Chance
- 0.0%
- Total Cost
- $9.26
210
Autograph Capsule | Counter Logic Gaming | Cologne 2016
ROI
31%
- Avg. Unbox
- $17.81
- Profit Chance
- 0.0%
- Total Cost
- $57.50
211
Paris 2023 Champions Autograph Capsule
ROI
29%
- Avg. Unbox
- $0.07
- Profit Chance
- 3.2%
- Total Cost
- $0.24
212
Copenhagen 2024 Champions Autograph Capsule
ROI
28%
- Avg. Unbox
- $0.11
- Profit Chance
- 3.8%
- Total Cost
- $0.39
213
Autograph Capsule | Group A (Foil) | Cologne 2015
ROI
27%
- Avg. Unbox
- $6.08
- Profit Chance
- 0.0%
- Total Cost
- $22.17
214
Budapest 2025 Legends Autograph Capsule
ROI
27%
- Avg. Unbox
- $0.10
- Profit Chance
- 2.8%
- Total Cost
- $0.35
215
Autograph Capsule | Group C (Foil) | Cologne 2015
ROI
26%
- Avg. Unbox
- $8.79
- Profit Chance
- 0.0%
- Total Cost
- $33.18
216
Autograph Capsule | Natus Vincere | Cologne 2016
ROI
26%
- Avg. Unbox
- $4.67
- Profit Chance
- 0.0%
- Total Cost
- $17.65
217
Budapest 2025 Champions Autograph Capsule
ROI
25%
- Avg. Unbox
- $0.07
- Profit Chance
- 2.6%
- Total Cost
- $0.28
218
Autograph Capsule | Fnatic | Cologne 2016
ROI
25%
- Avg. Unbox
- $3.20
- Profit Chance
- 0.0%
- Total Cost
- $13.04

219
EMS Katowice 2014 Challengers
ROI
25%
- Avg. Unbox
- $7,339.97
- Profit Chance
- 4.0%
- Total Cost
- $29,883.84
220
Autograph Capsule | Group D (Foil) | Cologne 2015
ROI
23%
- Avg. Unbox
- $8.57
- Profit Chance
- 0.0%
- Total Cost
- $36.85

221
Autograph Capsule | Fnatic | MLG Columbus 2016
ROI
23%
- Avg. Unbox
- $2.03
- Profit Chance
- 0.0%
- Total Cost
- $8.94
222
Stockholm 2021 Champions Autograph Capsule
ROI
22%
- Avg. Unbox
- $0.21
- Profit Chance
- 3.8%
- Total Cost
- $0.95
223
Autograph Capsule | Team Dignitas | Cologne 2016
ROI
19%
- Avg. Unbox
- $12.96
- Profit Chance
- 0.0%
- Total Cost
- $69.00
224
Autograph Capsule | Natus Vincere | MLG Columbus 2016
ROI
18%
- Avg. Unbox
- $1.75
- Profit Chance
- 0.0%
- Total Cost
- $9.51
225
EMS Katowice 2014 Legends
ROI
12%
- Avg. Unbox
- $4,034.41
- Profit Chance
- 2.0%
- Total Cost
- $32,872.39
226
Boston 2018 Legends Autograph Capsule
ROI
8%
- Avg. Unbox
- $11.53
- Profit Chance
- 0.6%
- Total Cost
- $138.16
227
Boston 2018 Minor Challengers Autograph Capsule
ROI
6%
- Avg. Unbox
- $26.44
- Profit Chance
- 0.4%
- Total Cost
- $417.36
228
Boston 2018 Legends (Holo/Foil)
ROI
0%
- Avg. Unbox
- $94.45
- Profit Chance
- 100.0%
- Total Cost
- $0.00
229
Boston 2018 Minor Challengers (Holo/Foil)
ROI
0%
- Avg. Unbox
- $55.62
- Profit Chance
- 100.0%
- Total Cost
- $0.00

230
Broken Fang Sticker Collection
ROI
0%
- Avg. Unbox
- $1.29
- Profit Chance
- 99.4%
- Total Cost
- $0.00
231
Cologne 2026 Autograph Capsule
ROI
0%
- Avg. Unbox
- $6.11
- Profit Chance
- 99.4%
- Total Cost
- $0.00
232
Cologne 2026 Sticker Capsule
ROI
0%
- Avg. Unbox
- $5.69
- Profit Chance
- 99.5%
- Total Cost
- $0.00
233
Cologne 2026 Team Sticker Capsule
ROI
0%
- Avg. Unbox
- $3.71
- Profit Chance
- 100.0%
- Total Cost
- $0.00

234
Operation Riptide Sticker Collection
ROI
0%
- Avg. Unbox
- $3.65
- Profit Chance
- 99.4%
- Total Cost
- $0.00

235
Recoil Sticker Collection
ROI
0%
- Avg. Unbox
- $1.33
- Profit Chance
- 96.2%
- Total Cost
- $0.00

236
Riptide Surf Shop Sticker Collection
ROI
0%
- Avg. Unbox
- $2.98
- Profit Chance
- 99.4%
- Total Cost
- $0.00

237
Shattered Web Sticker Collection
ROI
0%
- Avg. Unbox
- $0.64
- Profit Chance
- 99.4%
- Total Cost
- $0.00